Introduction
In today’s competitive business landscape, understanding and effectively catering to the needs of your customers is paramount for success. Customer segmentation, the practice of dividing customers into groups based on shared characteristics, allows businesses to personalize marketing efforts, optimize product offerings, and enhance overall customer experience.
In this project, I will delve into the world of customer segmentation using k-means clustering, a powerful machine learning algorithm. K-means clustering is an unsupervised learning technique that automatically groups similar data points together, making it an ideal choice for segmenting customers based on their demographic and behavioral traits.
Through this project, I aim to demonstrate my proficiency in data analysis and cleaning using R, a widely used programming language in the field of data science. By leveraging real-world customer data, I will showcase how k-means clustering can be employed to segment customers effectively.
Load Required Packages
Load and Explore Data
      ID Gender Ever_Married Age Graduated    Profession Work_Experience
1 462809   Male           No  22        No    Healthcare               1
2 462643 Female          Yes  38       Yes      Engineer              NA
3 466315 Female          Yes  67       Yes      Engineer               1
4 461735   Male          Yes  67       Yes        Lawyer               0
5 462669 Female          Yes  40       Yes Entertainment              NA
6 461319   Male          Yes  56        No        Artist               0
  Spending_Score Family_Size Var_1 Segmentation
1            Low           4 Cat_4            D
2        Average           3 Cat_4            A
3            Low           1 Cat_6            B
4           High           2 Cat_6            B
5           High           6 Cat_6            A
6        Average           2 Cat_6            C
Data Preprocessing
Code
customer_data <- customer[,2:9]

customer_data[customer_data == ""] <- NA
customer_data <- customer_data %>%
  filter(complete.cases(.))
data_numeric <- customer_data %>% select_if(is.numeric)
data_character <- customer_data %>% select_if(is.character)
data_character <- dummy_cols(data_character,
                             remove_most_frequent_dummy = TRUE)
data_character <- data_character %>% select(-c(1,2,3,4,5))
customer <- cbind(data_numeric, data_character)
Scale Data
Code
data_scale <- data.frame(scale(customer))
head(data_scale)
Age Work_Experience Family_Size Gender_Female Ever_Married_No
1 -1.3034647 -0.4786562 0.7603344 -0.9025373 1.2037141
2 1.4216419 -0.4786562 -1.2090499 1.1078226 -0.8306384
3 1.4216419 -0.7723730 -0.5525885 -0.9025373 -0.8306384
4 0.7555047 -0.7723730 -0.5525885 -0.9025373 -0.8306384
5 -0.6978855 -0.4786562 0.1038729 -0.9025373 1.2037141
6 -0.6373275 -0.4786562 0.1038729 1.1078226 1.2037141
Graduated_No Profession_Doctor Profession_Engineer Profession_Entertainment
1 1.3240158 -0.3114177 -0.3091117 -0.3715439
2 -0.7551656 -0.3114177 3.2345952 -0.3715439
3 -0.7551656 -0.3114177 -0.3091117 -0.3715439
4 1.3240158 -0.3114177 -0.3091117 -0.3715439
5 -0.7551656 -0.3114177 -0.3091117 -0.3715439
6 -0.7551656 -0.3114177 -0.3091117 -0.3715439
Profession_Executive Profession_Healthcare Profession_Homemaker
1 -0.2862963 2.2733660 -0.1649639
2 -0.2862963 -0.4398109 -0.1649639
3 -0.2862963 -0.4398109 -0.1649639
4 -0.2862963 -0.4398109 -0.1649639
5 -0.2862963 2.2733660 -0.1649639
6 -0.2862963 2.2733660 -0.1649639
Profession_Lawyer Profession_Marketing Spending_Score_Average
1 -0.2844665 -0.1895355 -0.5767344
2 -0.2844665 -0.1895355 -0.5767344
3 3.5148294 -0.1895355 -0.5767344
4 -0.2844665 -0.1895355 1.7336423
5 -0.2844665 -0.1895355 -0.5767344
6 -0.2844665 -0.1895355 -0.5767344
Spending_Score_High
1 -0.4211066
2 -0.4211066
3 2.3743421
4 -0.4211066
5 -0.4211066
6 -0.4211066Determine Optimal Number of Clusters
Code
set.seed(111)
fviz_nbclust(data_scale, kmeans, method = "wss")+
  labs(subtitle = "Elbow Method")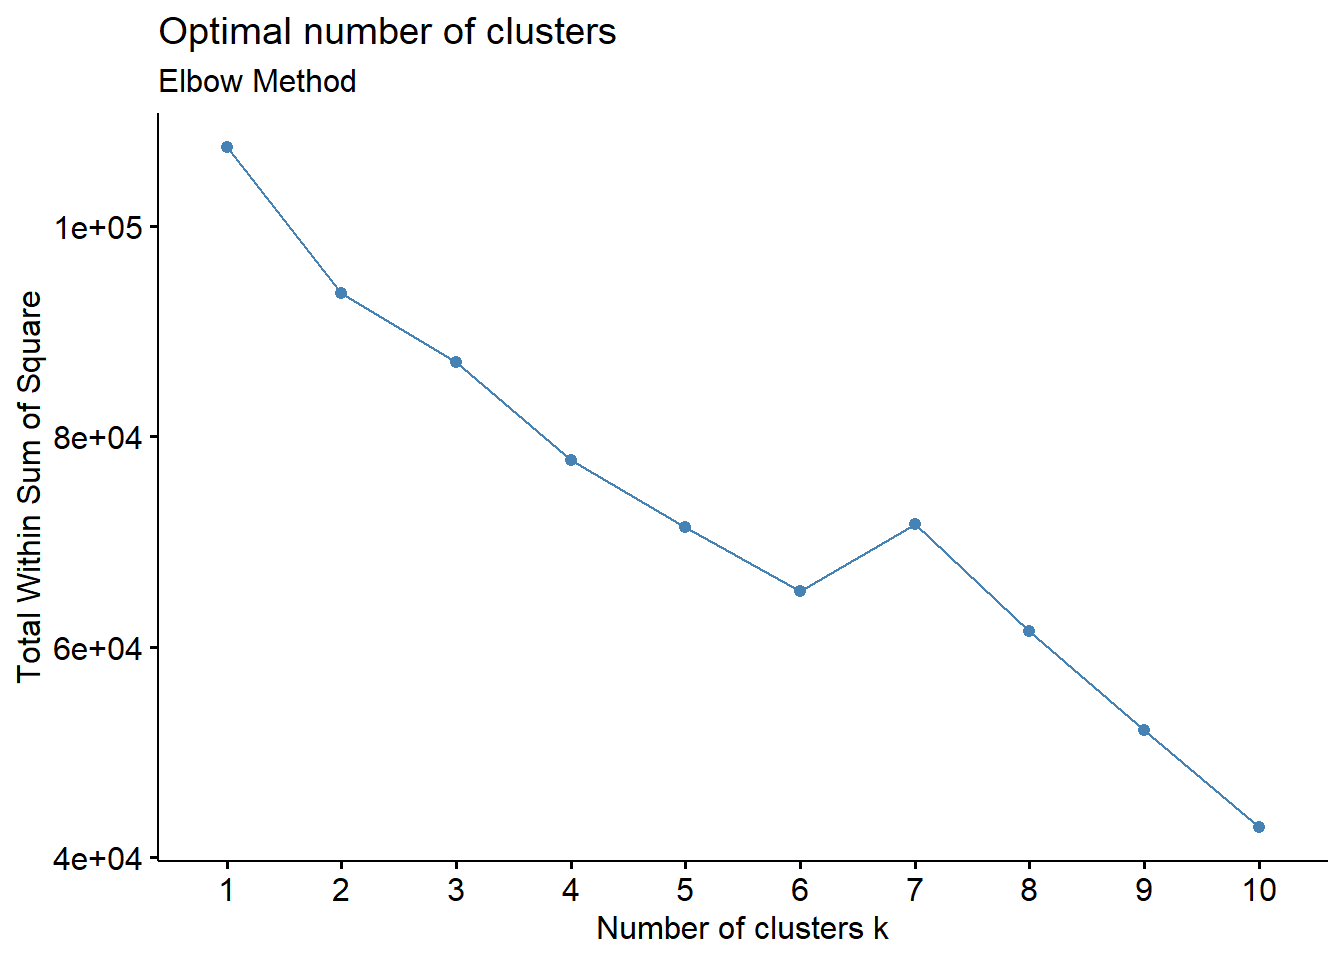
After visualizing the within-cluster sum of squares (WSS) for different numbers of clusters using the elbow method, it is observed that the plot displayed a clear ‘elbow point’ at k=6. The elbow point signifies the point at which adding more clusters ceases to significantly reduce the WSS. Prior to this point, increasing the number of clusters leads to a rapid decrease in WSS, indicating improved clustering performance. However, beyond the elbow point, the rate of decrease in WSS diminishes, suggesting that additional clusters may not capture substantially more variance in the data. Therefore, based on this analysis, i selected 6 clusters as the optimal number to effectively capture the underlying structure of the data while avoiding overfitting.
Kmean Clustering
Explanation of Each Cluster.
Code
# Summarize the characteristics of each cluster
customer <- customer %>% mutate(cluster = cluster$cluster)
cluster_summary <- customer  %>%
  group_by(cluster) %>%
  summarise_all(list(mean = mean))
(round(cluster_summary,2)) %>% data.frame()
cluster Age_mean Work_Experience_mean Family_Size_mean Gender_Female_mean
1 1 39.89 3.42 2.45 0.43
2 2 41.63 2.62 2.97 0.80
3 3 37.23 2.59 2.86 0.43
4 4 26.63 2.58 3.78 0.42
5 5 37.94 6.44 2.29 0.83
6 6 55.92 1.82 2.72 0.37
Ever_Married_No_mean Graduated_No_mean Profession_Doctor_mean
1 0.62 0.30 0
2 0.38 0.54 0
3 0.54 0.42 1
4 0.89 0.65 0
5 0.45 0.43 0
6 0.02 0.22 0
Profession_Engineer_mean Profession_Entertainment_mean
1 0 0.45
2 1 0.00
3 0 0.00
4 0 0.00
5 0 0.00
6 0 0.01
Profession_Executive_mean Profession_Healthcare_mean
1 0.01 0.00
2 0.00 0.00
3 0.00 0.00
4 0.00 0.99
5 0.00 0.00
6 0.20 0.00
Profession_Homemaker_mean Profession_Lawyer_mean Profession_Marketing_mean
1 0 0.0 0.12
2 0 0.0 0.00
3 0 0.0 0.00
4 0 0.0 0.00
5 1 0.0 0.00
6 0 0.2 0.00
Spending_Score_Average_mean Spending_Score_High_mean
1 0.17 0.02
2 0.31 0.09
3 0.27 0.04
4 0.03 0.03
5 0.26 0.10
6 0.38 0.35Cluster 1: This cluster represents a demographic of late-thirties career-oriented singles. They possess moderate work experience and tend to have smaller family sizes. Despite their relatively short tenure in the workforce, they exhibit a strong affinity for specialized professions like medicine and engineering, indicating a commitment to early career development. Predominantly female and unmarried, they likely prioritize professional advancement over family life. Despite their education and career focus, they maintain conservative spending habits, suggesting a cautious approach to finances. Marketing strategies for this group could emphasize career growth opportunities, professional networking events, and budget-friendly lifestyle products tailored to their early career aspirations.
Cluster 2: This cluster comprises individuals in their early forties with slightly higher work experience and larger family sizes compared to Cluster 1. The majority are female and married, with a notable proportion holding graduate degrees. Many work as engineers, suggesting a focus on technical professions. They exhibit a higher propensity for spending, especially on average and high-end products. Marketing efforts could target their family-oriented lifestyle, offering products and services that cater to their professional needs while accommodating their familial responsibilities.
Cluster 3: Individuals in this cluster are slightly younger, in their late thirties, with work experience and family sizes similar to Cluster 1. They show a balanced distribution in terms of marriage and education status. Notably, a significant portion work as doctors, indicating a strong presence in the healthcare profession. Their spending behavior leans towards the average range. Marketing strategies could focus on healthcare-related products and services, as well as career development opportunities for professionals in the medical field.
Cluster 4: This cluster represents a younger demographic, with individuals in their mid-twenties. They have lower work experience but larger family sizes compared to other clusters. The majority are unmarried and exhibit a lower rate of graduation. Almost all individuals in this cluster work in healthcare, suggesting a concentration in entry-level healthcare roles. Their spending tends to be low, reflecting their early career stage and possibly limited disposable income. Marketing strategies could target their specific needs as young professionals entering the healthcare field, offering educational resources and affordable products tailored to their lifestyle.
Cluster 5: Individuals in this cluster are similar in age to Cluster 3 but exhibit higher work experience and smaller family sizes. The majority are female, with a significant proportion being homemakers. They demonstrate a moderate spending behavior, with a notable percentage having a high spending score. Marketing efforts could focus on products and services that enhance their homemaking experience, as well as offerings that cater to their higher spending capacity, such as luxury household items or leisure activities.
Cluster 6: This cluster represents the oldest demographic, with individuals in their mid-fifties. They have the lowest work experience among the clusters but maintain moderate family sizes. Most are married and highly educated. While they have low representation in healthcare and entertainment professions, a significant portion work as executives, indicating a focus on leadership roles. They exhibit the highest average spending score, suggesting a comfortable financial position. Marketing strategies could target their affluent lifestyle, offering high-end products, exclusive experiences, and retirement planning services tailored to their needs and preferences.
Conclusion
Customer segmentation is a crucial step in understanding your customer base and tailoring marketing strategies to specific groups. In this project, I successfully segmented customers using k-means clustering based on their demographic and behavioral characteristics. By analyzing these segments, businesses can develop targeted marketing campaigns, optimize product offerings, and improve customer satisfaction and retention. K-means clustering in R provides a powerful tool for customer segmentation and can be further extended with additional analysis and interpretation.