Julius Ndung’u
  • Blogs
    • Statistical Tests
    • Machine Learning
    • Data Visualization
    • East Africa
    • Dashboard And it’s Importance
    • Kenya GDP growth(10% by 2030)
    • Experimental Designs
  • Projects
  • ABOUT ME

Time Series

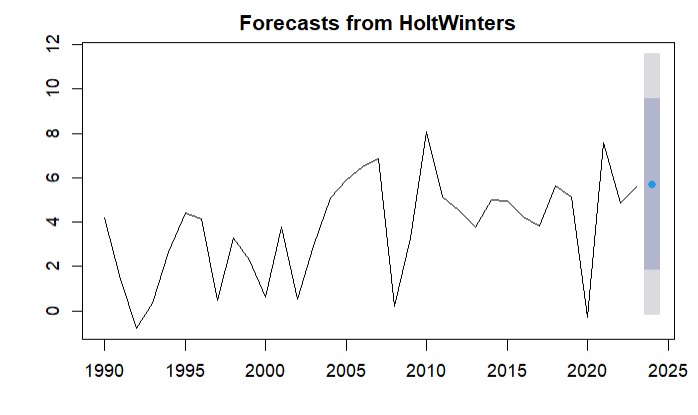
Time series analysis involves analyzing data points collected or recorded at specific time intervals. It allows us to understand underlying patterns such as trend, seasonality, and cyclicity, which helps in making accurate forecasts. The two primary goals of time series analysis are to understand the underlying patterns in the data and to forecast future values. We will explore two popular methods The Holt-Winters method and the ARIMA model, using R to predict Kenya’s GDP Growth Rate for 2024.
Jul 21, 2024

Support Vector Machines (SVM)

Support Vector Machines (SVM) are powerful supervised learning models used for classification and regression tasks. SVMs work by finding the hyperplane that best separates the classes in the feature space. R provides excellent packages like e1071 and caret to build and evaluate SVM models.
Jul 12, 2024

Decision Trees in R

Decision trees are a popular and intuitive method for both classification and regression tasks in machine learning. They work by splitting the data into subsets based on the value of input features, making a sequence of decisions that lead to a prediction. R provides powerful packages such as rpart and caret to easily build and visualize decision trees.
Jul 11, 2024

Random Forest

Random Forest is a powerful ensemble learning method used for classification and regression tasks. It operates by constructing multiple decision trees during training and outputting the mode of the classes (classification) or mean prediction (regression) of the individual trees. This method improves the model’s accuracy and reduces overfitting. R provides excellent packages such as randomForest and caret to build and evaluate random forests.
Jul 11, 2024

Logistic Regression

Unlike linear regression, which predicts continuous outcomes, logistic regression is specifically designed for binary outcomes. It models the probability of the occurrence of a categorical response variable based on one or more predictor variables. The logistic regression model transforms the linear combination of predictors using the logistic function (also known as the sigmoid function) to constrain the predicted values between 0 and 1
Jun 20, 2024
Julius

Multiple Linear Regression

While simple linear regression models the relationship between two variables, multiple linear regression extends this concept to include multiple independent variables.
Jun 3, 2024
Julius Ndung’u

Poisson Regression

Poisson regression models the relationship between one or more independent variables and a count-dependent variable. It assumes that the dependent variable follows a Poisson distribution, which is appropriate for count data with non-negative integer values.
Jun 3, 2024
Julius Ndung’u

Multinomial Logistic Regression

Multinomial logistic regression is a statistical method used to model the relationship between a categorical dependent variable with more than two levels and one or more independent variables. Unlike binary logistic regression, which deals with dichotomous outcomes, multinomial logistic regression can handle outcomes with three or more categories. This method is widely used in various fields such as social sciences, marketing, and healthcare to predict categorical outcomes based on predictor variables.
Jun 2, 2024
Julius Ndung’u

Simple Linear Regression

Simple linear regression is a statistical method used to model the relationship between two continuous variables. It aims to describe how one variable (dependent variable,Y) changes in response to changes in another variable (independent variable,X).
May 23, 2024
Julius Ndung’u
No matching items
Made with Quarto in R
Contact me
© Copyright 2024, Julius