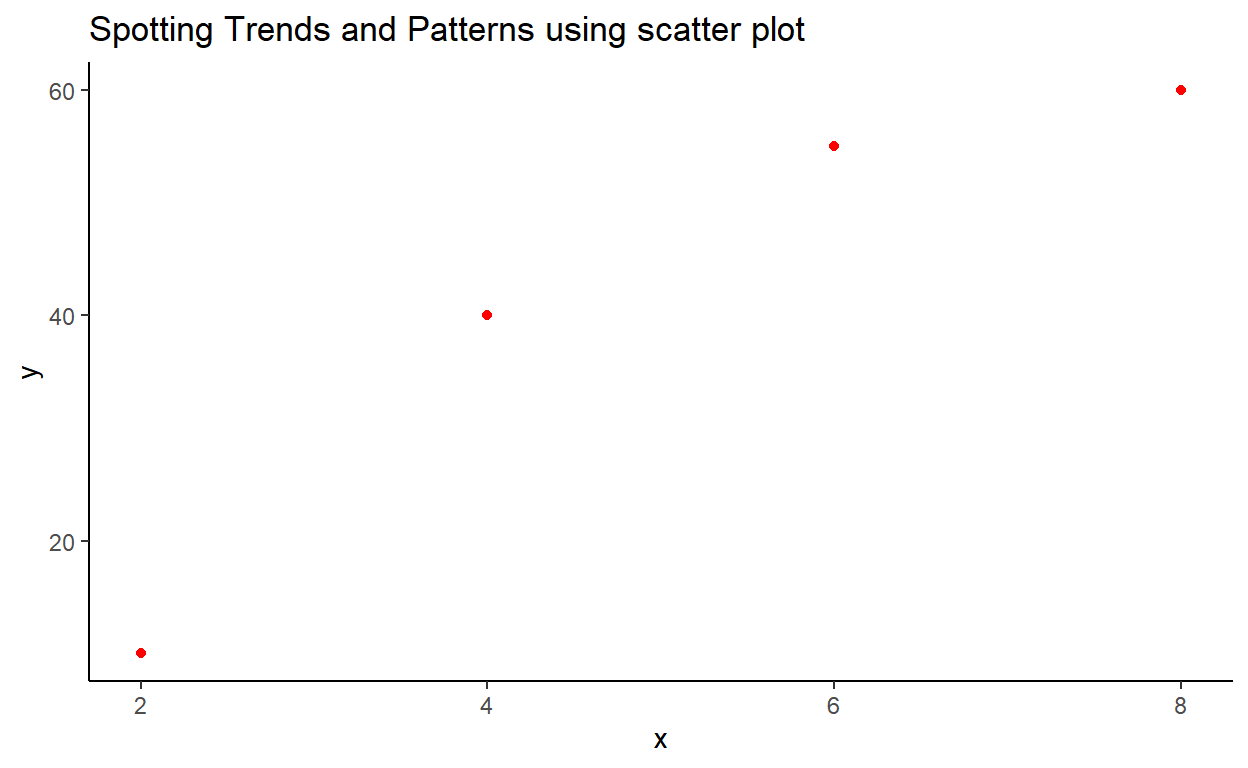
Data Visualization with Scatter Plots in R
Scatter plots are a fundamental tool in data visualization, used to display the relationship between two numerical variables. By plotting data points on a Cartesian plane, scatter plots help identify patterns, correlations, and outliers within a dataset. This article explores the importance of scatter plots, demonstrates how to create them using R, and showcases several variations to highlight their versatility.