Code
# A tibble: 6 × 2
  before after
  <chr>  <chr>
1 +      -
2 +      +
3 -      -
4 +      -
5 +      -
6 + - McNemar’s test is a non-parametric statistical test used to analyze paired nominal data. It is particularly useful for assessing changes in responses for matched pairs or before-and-after studies.
McNemar’s test evaluates the differences in proportions for paired data. It is often used to determine whether there is a significant change in the proportion of subjects exhibiting a particular characteristic before and after an intervention, or between two related groups.
You have paired nominal data.
You want to test for differences in proportions between two related groups or before and after an intervention.
Hypotheses in McNemar’s Test McNemar’s test involves two hypotheses:
Null Hypothesis (H0): The proportions of discordant pairs are equal (no difference in the proportions).
Alternative Hypothesis (H1): The proportions of discordant pairs are not equal (there is a difference in the proportions).
Paired Data: The data should be paired, meaning each subject is measured twice (before and after) or matched pairs are used.
Nominal Data: The data should be nominal (categorical).
Let’s go through a practical example to understand how to perform McNemar’s test in R.
Let’s consider a scenario where a drug was administered to 20 patients who were suffering from a certain disease. Patients were tested for disease before the drug was administered to them and after the drug was administered to them. Now we need to find whether the drug was effective in curing the disease or not.
mcnemar.test(data$before, data$after, correct = F)
    McNemar's Chi-squared test

data:  data$before and data$after
McNemar's chi-squared = 5.4444, df = 1, p-value = 0.01963You can cite this package as:
Patil, I. (2021). Visualizations with statistical details: The 'ggstatsplot' approach.
Journal of Open Source Software, 6(61), 3167, doi:10.21105/joss.03167ggbarstats(
data = data,
x = before,
y =after,
paired = T,label = "both"
)+labs(title = "McNemar Test in R")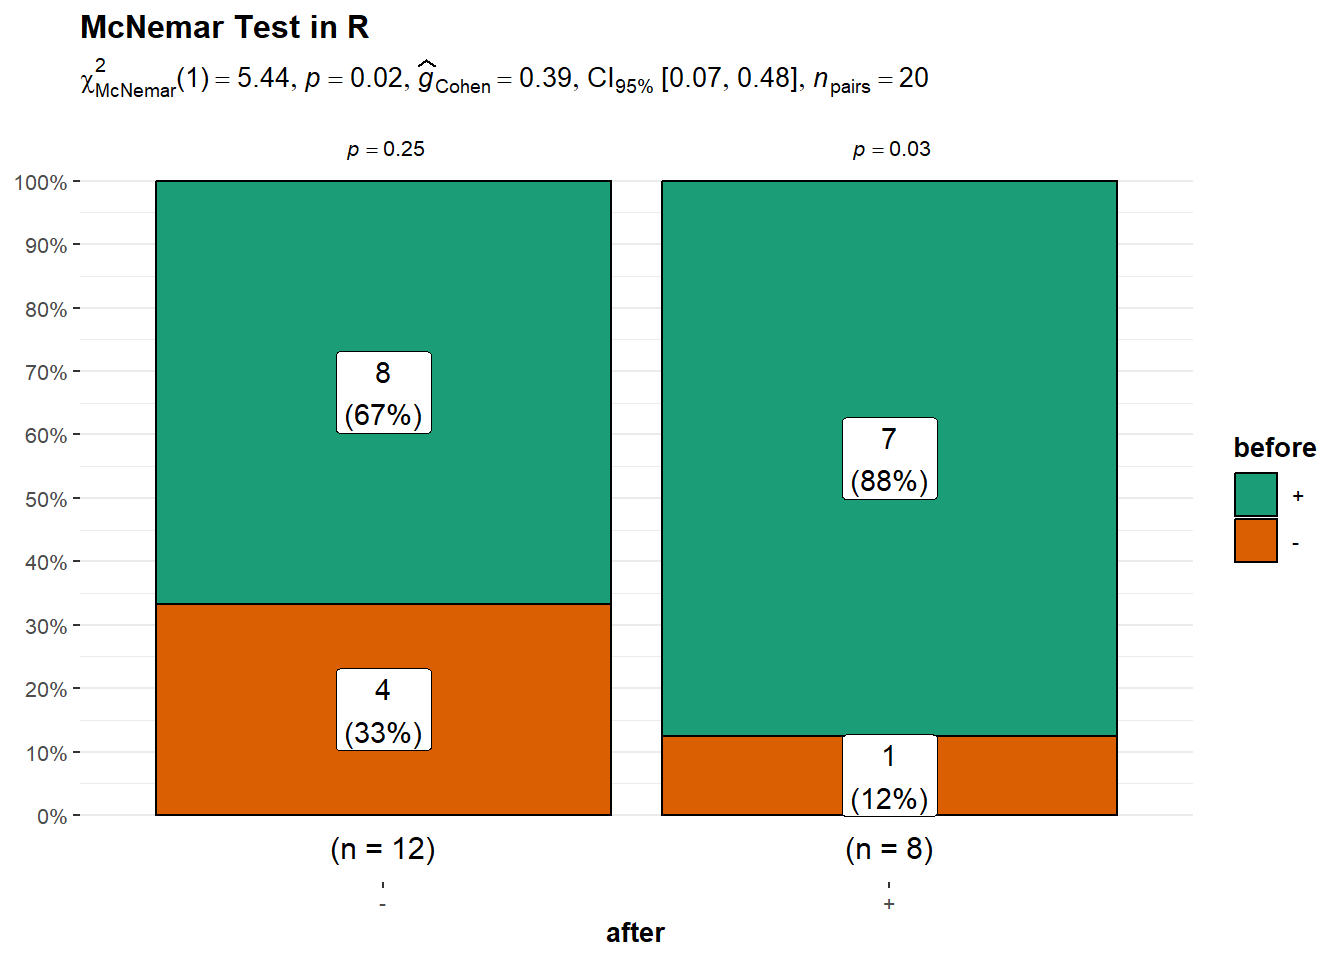
Since the p-value (0.01963) is less than the significance level (typically 0.05), we reject the null hypothesis. This means there is enough evidence to conclude that there is a significant difference in the proportions of patients responding positively before and after the treatment Thus the drug was effective
library(effectsize)
interpret_cohens_g(0.39)
[1] "large"
(Rules: cohen1988)Effect size is large indicating that the ability of the drug to cure the disease is significant and large.